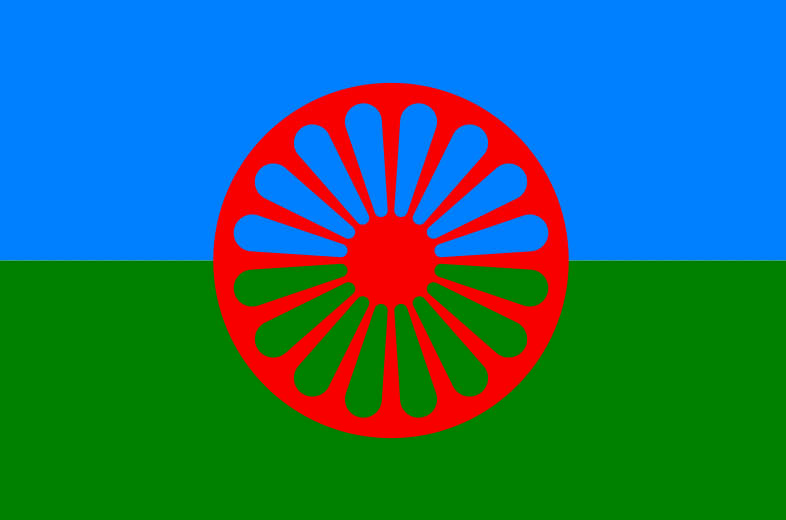
A people without borders [editar]
The term Roma, adopted at the 1st World Roma Congress held in London in 1971, is a unifying label for the various Roma populations worldwide, although more specifically some scholars advocate speaking of three major groups: the Roma, the Sinti and the Calés.
Additionally, there are other groups traditionally denominated according to their trades or geographical locations: kalderas, manuches, etc.
In some countries there are communities that, while not ethnically Roma, embrace lifestyles akin to their nomadic tradition: the Travellers in the United Kingdom or Les Gens du Voyage in France and other countries.
Roma people in Spain
Absence of ethnic data in official population censuses makes it very difficult to quantify the number of Roma inhabitants in Spain.
Based on sociological studies (such as the one carried out by the Roma Secretariat in 1978, with a sample of approx. 20 000 people), it is estimated that around 725 000 people reside in Spain, about 1.57% of the total Spanish population.
The Spanish Roma population is mostly young, with approximately one-third of its members being under the age of 16.
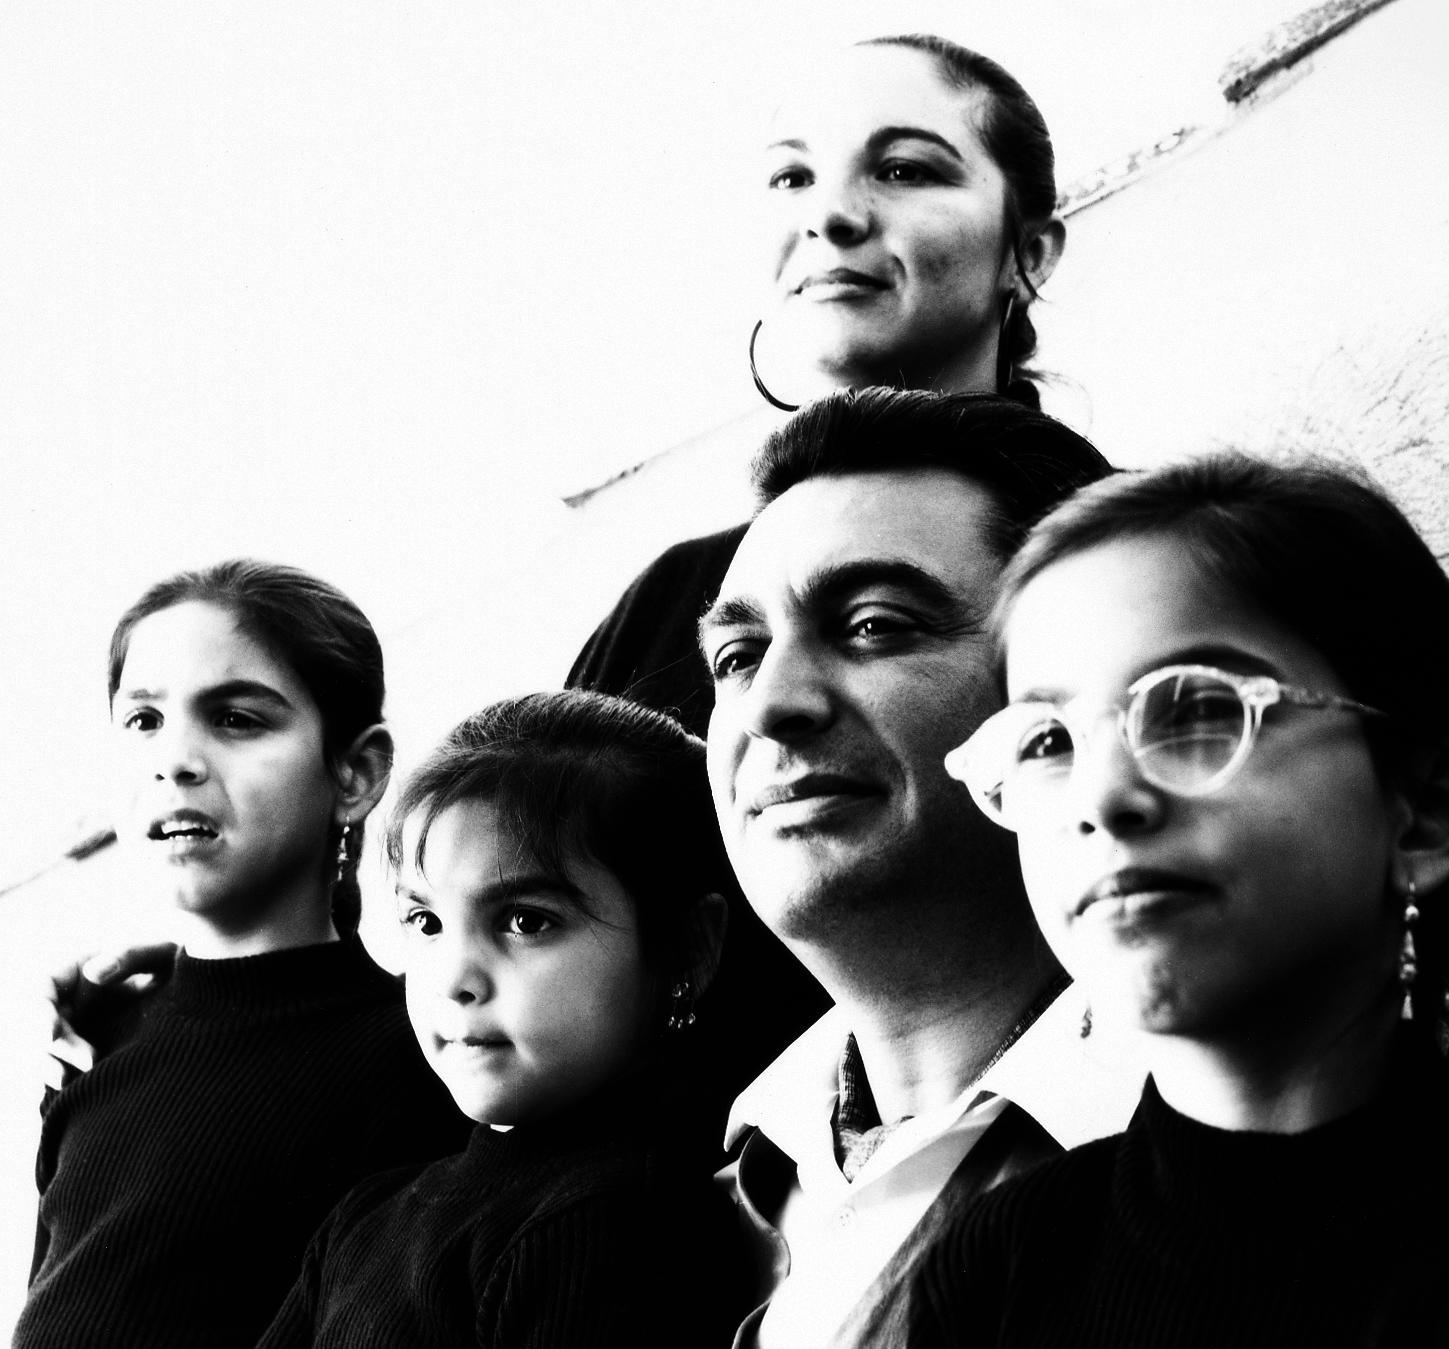
During the early years of the 21st century, the migration of Roma from Eastern Europe (mainly Romania and Bulgaria) to Spain has intensified, especially since the incorporation of these Eastern European countries into the EU in 2007. Presently, it is estimated that around 50 000 Roma from these countries reside currently in Spain. (Photo: Jesús Salinas)
Further information
- Los roma/gitanos en Europa. Un poco de historia (Comisión Europea. En Revista Gitanos, nº29) (in Spanish)
- La situación de los Roma/Gitanos en la Unión Europea ampliada (Comisión Europea. En Revista Gitanos, nº29) (in Spanish)
- LIBRO - A. Gómez Alfaro, Legislación histórica dedicada a los gitanos, Sevilla, Junta de Andalucía, 2009 (in Spanish)
- VIDEO - En Portada. “Los gitanos, europeos sin estado” (RTVE, 2005) (in Spanish)
- Migraciones de los roma/gitanos de Rumanía / Almudena Macías. En revista "Gitanos", nº45-46, oct. 2008 (in Spanish)
- Romani People (Wikipedia)
- History of the Romani People (Wikipedia).